Goals:
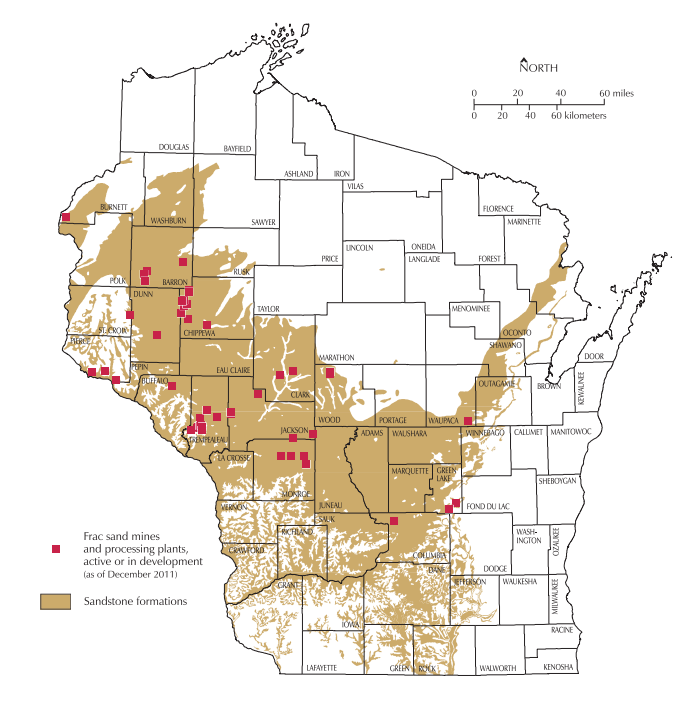
The goal of this lab was to use multiple geoprocessing tools to build models for sand mining suitability as well as sand mining impacts on the environment and culture in Trempealeau County, Wisconsin.
In this exercise, I had to build a sand mining suitability model, build a sand mining risk model, and overlay the two models to find the best locations for sand mining with minimal environmental and community impacts.
Data Sets and Sources:
The data sets and sources used for this lab were from Trempealeau county public database, NLCD land use data, USGS DEM data, and water table data from the Wisconsin Geological and Natural History Survey.
Objectives:
Suitability Model

3: Barren Land, Herbaceuous, Hay, Pasture, Cultivated Crops
2: Shrub, Scrub 2
1: Deciduous Forest, Evergreen Forest, Mixed Forest
For Open Water, Developed, Open Space Developed, Low Intensity Developed, Medium Intensity Developed, High Intensity, Woody Wetlands I assigned 0 to exclude these from my suitability results.


Objective 4: The fourth objective was to find suitable land based on slope. I ran the slope calculator tool on the Trempealeau county DEM file which gave me a percent rise.


Objective 5: The fifth objective was to rank areas of land where the water table is closer to the surface. In order to do this, I needed coverage files from the WI Geological Survey website. I then had to import them into my geodatabase before creating a raster from the contour lines using the topo to raster tool. I once again ranked and reclassed the results.


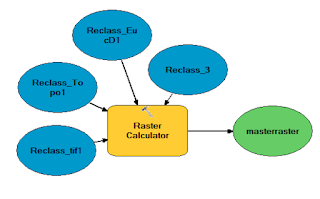
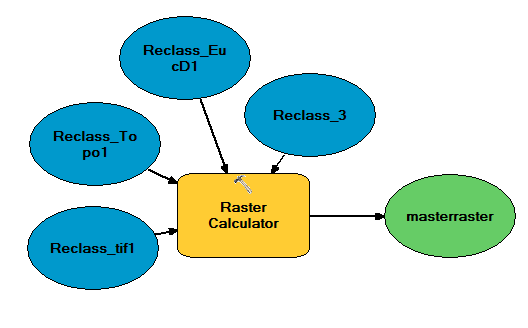
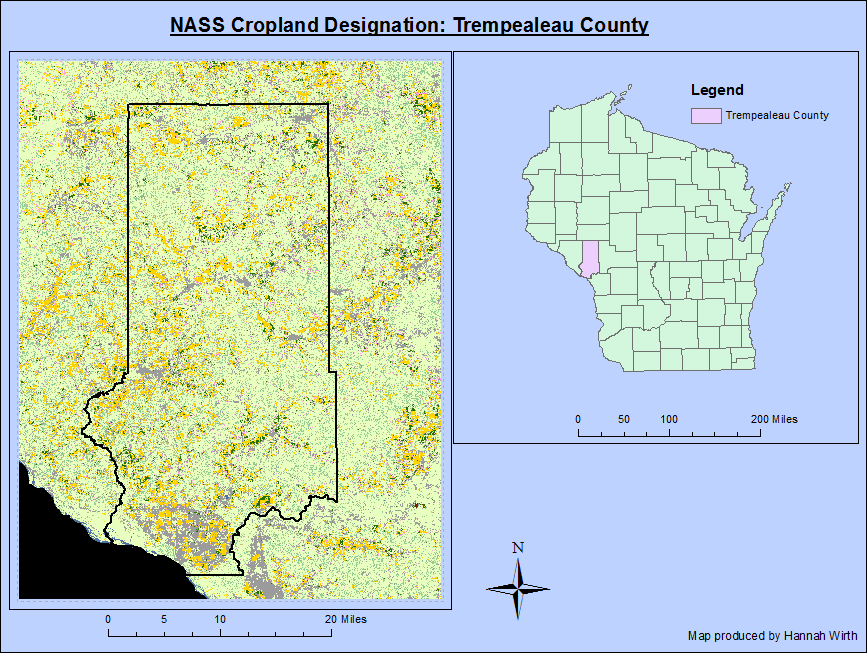
Objective 6: The sixth objective was to combine all of the objectives into one index model that adds up all of the ranks I had assigned in each of them. I used raster calculator to create a master raster of the criteria. The suitability map is figure 1 shown below.
 |
| Figure 1: This map is a suitability model for sand mining in Trempealeau County |
Objective 7: The task for objective seven was to exclude all land uses that were not suitable to include in the suitability model. These included: open water, developed land, and woody wetlands. I already excluded the unwanted data in objective two.
Impact Model
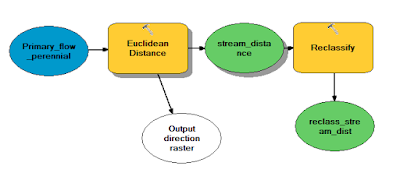
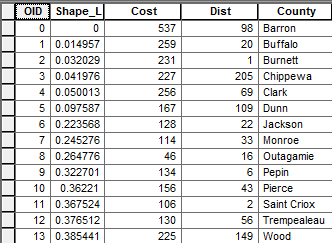
Objective 8: The eighth objective included using a DNR-hydro feature class to see the environmental impact potential in the areas where sand mining operations occur. I only included primary flow perennial streams. I then used the euclidean distance tool to calculate and reclassify the distances in the same three criteria as before (3=High, 2=Medium, and 1=Low).

Objective 9: In the ninth objective, I projected a prime farmland feature class before converting it to a raster. Next, I used the reclass tool to rank the land based on land that was prime farmland (or valuable farmland).


Objective 10: In objective ten, I had to determine the impact based on distance to residential or populated areas. I used a feature class containing corporate district limits. Next, I performed euclidean distance on it, making sure that no sand mines are within 640 meters of a residential area. The three distance classifications represent a dust shed for potential mines.

Objective 11: Objective eleven was to determine potential impact on schools. This meant starting with the parcels feature class and querying all parcels that contained the word 'school'. Then, I created a new feature class with property owned by schools. After that I used the euclidean distance tool and reclassified the results into the three rankings.
 Objective 12: For objective twelve, I chose to look at parks in Trempealeau County. I used the euclidean distance tool and reclassify tool on the parks feature class to determine impact rankings.

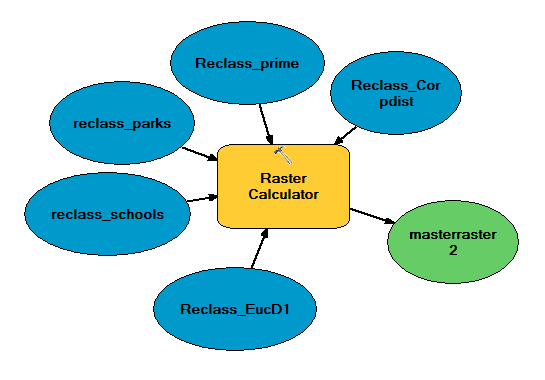
Objective 13: Objective thirteen was to calculate risk. The idea is the same as the first suitability model. I am used raster calculator to add up the values in each raster to determine the impact.

Objective 14: The final objective was to overlay the two models together. The final outcome shows where to find best locations for sand mining with minimal environmental and community impact. In order to do this, I had to subtract the environmental impact raster from the suitability raster. This map is in the results section.

Objective 15: The Python script for this exercise is the third script in the "Python Script" post in this blog.
Results: The final map (figure 2 down below), was an overlay between the suitability model and the environmental impact model. Everything in green signifies an area of high suitability and low environmental impact. Areas that are red signify low suitability with high environmental impact.
It is interesting to see the final model and what it represents. This is a map produced with real data, but is no means an answer to suitability/environmental impact problems. The area of green and a little bit of the orange are areas of high suitability. Areas in red are areas that have low suitability and high environmental impacts.
Conclusion: The final suitability and environmental impact model is a collective map of 10 rasters calculated through ArcMap. While working with raster modeling, I have learned how to properly take a feature class and convert it into a raster. I have also learned how to run the Euclidean Distance tool to create a raster of an area. The other major tool I learned to efficiently use was the reclassify tool. This tool makes it possible to use the raster calculator mathematics on rasters that are uniform. The geoprocessing tools use simple mathematics equations to create raster data that is extremely useful.

Objective 11: Objective eleven was to determine potential impact on schools. This meant starting with the parcels feature class and querying all parcels that contained the word 'school'. Then, I created a new feature class with property owned by schools. After that I used the euclidean distance tool and reclassified the results into the three rankings.


Objective 13: Objective thirteen was to calculate risk. The idea is the same as the first suitability model. I am used raster calculator to add up the values in each raster to determine the impact.
Overlay

Objective 15: The Python script for this exercise is the third script in the "Python Script" post in this blog.
Results: The final map (figure 2 down below), was an overlay between the suitability model and the environmental impact model. Everything in green signifies an area of high suitability and low environmental impact. Areas that are red signify low suitability with high environmental impact.
 |
| Figure 2: This is the map of the suitability model and the environmental impact model combined |
Conclusion: The final suitability and environmental impact model is a collective map of 10 rasters calculated through ArcMap. While working with raster modeling, I have learned how to properly take a feature class and convert it into a raster. I have also learned how to run the Euclidean Distance tool to create a raster of an area. The other major tool I learned to efficiently use was the reclassify tool. This tool makes it possible to use the raster calculator mathematics on rasters that are uniform. The geoprocessing tools use simple mathematics equations to create raster data that is extremely useful.


