Friday, April 22, 2016

Network Analysis


Goals and Objectives: The goal of this assignment is to learn how to perform network analysis. In the first part of this assignment, we had to write a python script to select the mines that would be used for network analysis. We are trying to figure out what the hypothetical cost is on the roads the trucks use to transport sand from the mine to the rail station.

Methods: The beginning of this project was getting a python script ready to use for network modeling. Once that was complete, we used network modeling to do efficient route modeling. The main tool we used was "find nearest facility". We used this is find the nearest rail station to the sand mines. The network dataset that contains the roads came from ESRI streetmap, the mine data came from the Wisconsin DNR, and the rail data came from the Department of Transportation.

Next, was to create a data flow model. By creating the data flow model, I could clearly see what the exact steps were in the modeling process.
Figure 1: The data flow model above shows the step-by-step actions I took to get my results

Figure 2: The map above shows the routes the trucks have to use to get the sand to the rail stations.
Source: ESRI street map USA
The map above shows where the rail stations are as well as where the mines are. The map also shows the truck routes taken from the mine sites to the rail stations and back again. The constant driving with heavy material back and fourth causes stress on the roads. The table below shows how each county in Wisconsin is affected by the trucks driving on public roads. 

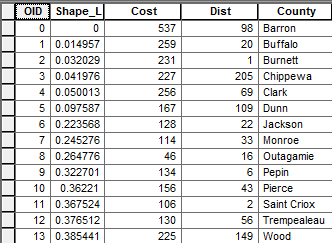
Figure 3: The table above is the final product showing the county, cost of road repair, and the distance the truck has to travel.
Conclusion:
After analyzing the results, I can't help but wonder how the counties plan on paying for the roads. It does not make sense for the taxpayers to pay the bill when the trucks from the mining companies are the vehicles doing the most damage on the roads. 
Once the background is set for network analysis, it is a very useful tool to help map out a potential route for something. This project was interesting and important because it is such a large scale local problem. 

Sources:
ESRI street map USA
Wisconsin DNR
Department of Transportation


Friday, April 8, 2016

Data Normalization, Geocoding, and Error Assessment for Western Wisconsin Sand Mine Locations


Goals and Objectives:

The main goal for this assignment is to geocode the locations of all the sand mines in Western Wisconsin and compare the results. The six main objectives for this exercise are the following: normalize the mine locations in the MS Excel table, connect to the geocoding service from ESRI and geocode the 16 mines that were given to you, connect to the ArcGIS online server for UWEC and add the PLSS feature class, manually locate the mines from your 16 that have a PLSS location, and finally compare your results with the results of the other students in class. In order to reach the end goal, it was critical to know how to normalize the data that was given to us. Once the data was normalized, it made geocoding much easier and more accurate.


Methods:

The first step in the geocoding process was to normalize the data. Figure 1 shows how the data was given to us from the Wisconsin DNR. The address information was not uniform. Some had the PLSS address, some had the actual address, and some had both. Figure 2 shows the data after it has been normalized. The data in figure 2 is ready to be geocoded. Once the normalized data is imported into ArcMap, the geocoding process can begin.

Figure 1. The data was given to us in an Excel table and was not normalized

Figure 2. The data has been normalized and is ready for geocoding
Once all of the points were geocoded, it was time to gather everyone's data from a shared location. I merged the data and queried out the mine locations that were in common with my mine locations.


Results:

After trial and error with different tools, I was able to figure out my mine locations in comparison to my classmates' mine locations. The point distance tool was useful to see the amount of error that occurs from person to person. Error is inevitable in geocoding locations.
Figure 3. This is a map of my geocoded mines as well as five of my classmates geocoded mines
Source: Wisconsin DNR

Discussion/Conclusion:

There were two different ways of geocoding the mine locations. The easiest way was using the address provided by the Wisconsin DNR. The other way was taking the PLSS address and figuring out where it is on the map. Some of the places were difficult to find on the background map, so I had to use Google Earth to find out where the mine is and then match it in ArcMap.

In figure 3 it is apparent that not all of the locations were geocoded exactly the same. There is distance error for every mine site.

The most frustrating thing about this project was getting all of the shapefiles merged into one shapefile. The data was not normalized because we all took different approaches in geocoding our mine locations. It is important to understand how difficult it can be to normalize and merge data. The feeling of success after struggling is great. This was a very stressful yet rewarding assignment.

Sources:

Google Maps- https://www.google.com/maps

ESRI Online- http://www.esri.com/software/arcgis/arcgisonline 

Wisconsin DNR- http://dnr.wi.gov/